Forum sponsored by:

Meteor detecting
| SillyOldDuffer | 18/06/2018 17:31:13 |
| 10668 forum posts 2415 photos | Posted by Jon on 18/06/2018 16:54:55:. ... Used to like making HF beams. Having a gigantic birdcage on your roof should be a status symbol. Ideally it should glow in the dark. My neighbours are so unimaginative. They even think owning a lathe is eccentric. Ho hum. |
| Andrew Tinsley | 18/06/2018 18:11:09 |
| 1817 forum posts 2 photos | Hello Muzzer, Point taken, I must be more careful about my prefixes! Andrew. |
| Neil Wyatt | 18/06/2018 19:44:58 |
 19226 forum posts 749 photos 86 articles | Hmm... that mast is only 4m high, not 32 feet. It's stood upright for about 15 years with a weather station on top with similar windage... |
| Jon Lawes | 18/06/2018 20:08:06 |
 1078 forum posts | Posted by SillyOldDuffer on 18/06/2018 17:31:13:
Posted by Jon on 18/06/2018 16:54:55:. ... Used to like making HF beams. Having a gigantic birdcage on your roof should be a status symbol. Ideally it should glow in the dark. My neighbours are so unimaginative. They even think owning a lathe is eccentric. Ho hum.
If your lathe is eccentric may I suggest balancing the chunk or wedging the baseplate? |
| daveb | 18/06/2018 21:54:36 |
| 631 forum posts 14 photos | Posted by Rik Shaw on 18/06/2018 07:50:57:
Thirty something years ago we were camping on a site by Chesil beach. It was a clear but moonless night around two in the morn and black as your hat when I unzipped the tent flap to visit the site toilet. What I saw near took my breath away. I have never seen so many stars in the sky before or since. I saw two shooting stars before I had even reached the lav - an unforgettable memory! (the stars - not the lav) Rik
Light pollution makes it difficult to see the night sky, mountains are probably the best place to view, if you haven't seen it before you will be amazed at the number of stars in the sky. Dave
|
| Rik Shaw | 18/06/2018 22:25:51 |
 1494 forum posts 403 photos | Good point Dave and as you observe, light pollution is a problem, but back then and in such an isolated location with zero local lighting the sparkling magnificence was still pretty impressive with a milky way to die for! Rik |
| Doubletop | 19/06/2018 06:39:50 |
 439 forum posts 4 photos | Posted by Neil Wyatt on 17/06/2018 20:53:02:
Posted by Rik Shaw on 17/06/2018 20:44:51:
With that Sky dish pointing earthward you are unlikely to receive anything other than Mrs Dales Diary or Gardeners Question Time Rik Sadly the Sky dish is accurately aligned... For OPTUS D1 and Home and Away and Neighbours? |
| Journeyman | 19/06/2018 10:28:31 |
 1257 forum posts 264 photos | I have to ask: Why do you want or indeed need to detect meteors? It sounds about as useful as George Merryweather's Tempest Prognosticator. If the meteor is big enough you will definitely know if it has become a nearby meteorite John |
| Jon Gibbs | 19/06/2018 10:45:05 |
| 750 forum posts | It sounds a fun thing to try. I did some research into meteor burst communications a while back - trying to maximize the data throughput - because as the ionization trail dies away the reflectivity, and hence the link capacity, diminishes. The problem with meteors as a means of communication is that they are not regular throughout the day. The earth mops up lots more meteors at 6am local time than it does at 6pm where only those travelling faster than the earth can graze the ionosphere. Jon |
| Geoff Theasby | 19/06/2018 10:56:37 |
| 615 forum posts 21 photos | Bernard Lovell, using ex-radar equipment, at Jodrell Bank in 1946, was the first to discover and detect meteors during the day. Geoff |
| Neil Wyatt | 19/06/2018 17:34:06 |
19226 forum posts 749 photos 86 articles | Posted by Journeyman on 19/06/2018 10:28:31:
I have to ask: Why do you want or indeed need to detect meteors? It sounds about as useful as George Merryweather's Tempest Prognosticator. If the meteor is big enough you will definitely know if it has become a nearby meteorite John Why sit in a workshop making useless objects when you could be out in the fresh air?
Edited By Neil Wyatt on 19/06/2018 17:34:20 |
| Neil Wyatt | 19/06/2018 17:38:41 |
19226 forum posts 749 photos 86 articles | Posted by Jon Gibbs on 19/06/2018 10:45:05:
It sounds a fun thing to try. I did some research into meteor burst communications a while back - trying to maximize the data throughput - because as the ionization trail dies away the reflectivity, and hence the link capacity, diminishes. The problem with meteors as a means of communication is that they are not regular throughout the day. The earth mops up lots more meteors at 6am local time than it does at 6pm where only those travelling faster than the earth can graze the ionosphere. Jon Funnily enough although that's generally true, at the moment the current shower is the 'Daylight Arietids' which comes roughly from the direction of the sun and over the last half hour I was picking up one every minute or two. |
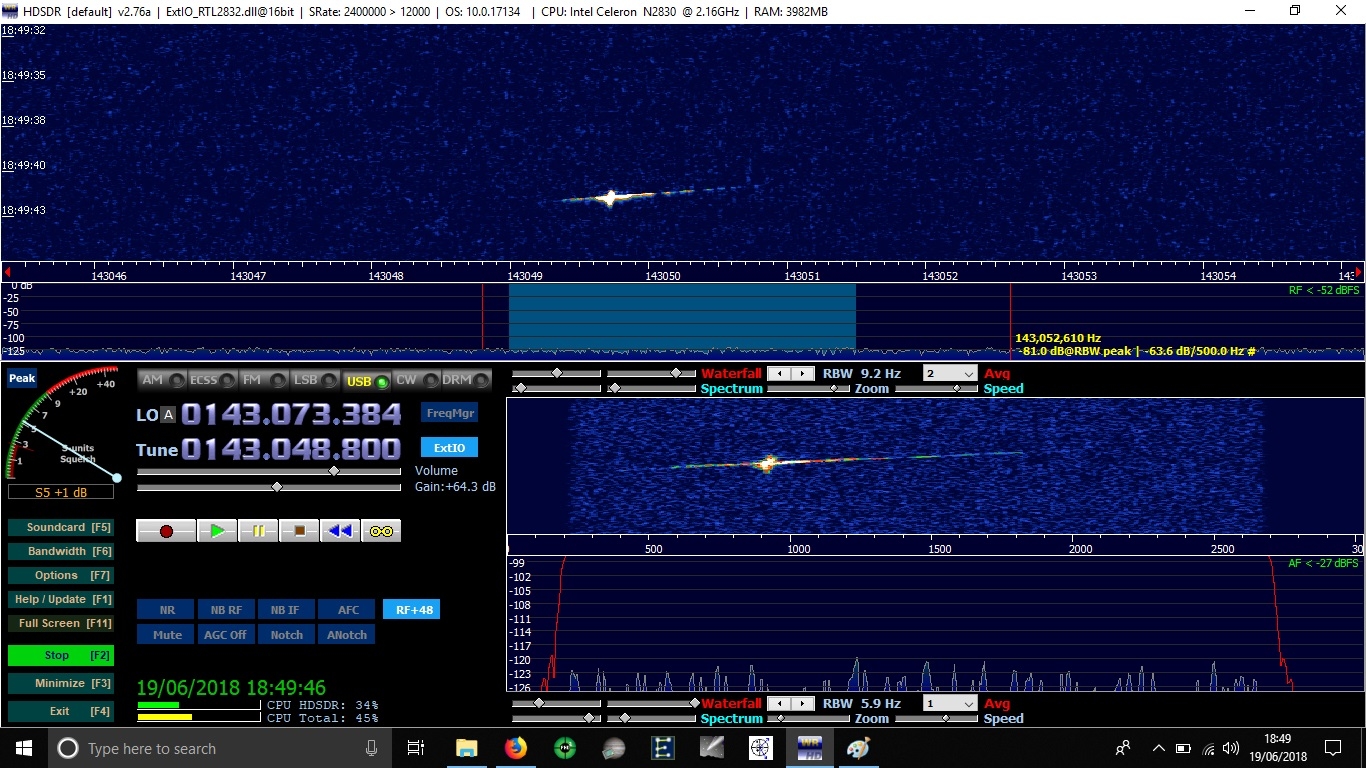
| Neil Wyatt | 19/06/2018 23:08:57 |
19226 forum posts 749 photos 86 articles | How about this for a biggy? The long line is the meteor slowing down, the big 'flash' is the ionisation cloud. Probably...
|
| Doubletop | 20/06/2018 04:24:54 |
439 forum posts 4 photos | Neil Can you describe what we are looking at here please? I've been wondering what it is you are receiving. From what I’ve read here I guess it is the signal from the source being reflected of the ionisation trail. But what are you capturing? The reflected broadcast FM signal, the doppler shifted CW component or both? As your last note suggests ‘slowing down’ so I guess you are getting the doppler shift in the X axis but is Y amplitude and the ‘big flash’ being the stronger reflected signal from the ionisation cloud? As I also guess the display is aggregated over time how is that represented? If you are getting the doppler shifted signal can you determine the velocity of the vector in the axis towards the receiver? Pete |
| Geoff Theasby | 20/06/2018 05:06:08 |
| 615 forum posts 21 photos | I was going to let Neil explain, but I had this idea... This is a HDSR display, generated in the computer. It is listening to Graves radar, on 143.0488 MHz, which it can not hear, but when a meteor passes, the Graves signal is reflected, leaving a trail on the 'Waterfall' display. Imagine a loom weaving cloth, which slowly lengthens, as the shuttle passes back & forth through the 'shed' formed by the raising and lowering of the alternate threads. If something is trapped in there, a lump will form, and be incorporated into the cloth. This is like a waterfall display. Geoff |
| Doubletop | 20/06/2018 05:34:12 |
439 forum posts 4 photos | Geoff Thanks; a bit early in the day? I get the concept of a waterfall display. So Y is time, with current time at the bottom and and X is frequency rising from left to right. Pete (edited I've just realised I can zoom the image)
Edited By Doubletop on 20/06/2018 05:37:02 |
| Doubletop | 20/06/2018 06:10:41 |
439 forum posts 4 photos | The main signal has a doppler shift of 900Hz and (using an online calculator) a velocity of ~950m/sec or 2125mph (towards Neils house) Pete ( could well be wrong....) |
| Geoff Theasby | 20/06/2018 08:55:24 |
| 615 forum posts 21 photos | Early? I'm often conscious, if not compos mentis, earlye in the morning. Geoff |
| Neil Wyatt | 20/06/2018 09:34:20 |
19226 forum posts 749 photos 86 articles | To try and answer multiple posts. As Geoff says it's a 'waterfall' display but falling upwards, so the oldest data is at the top. Frequency is the x-axis and brightness/colour shows signal strength. The big blob is probably a stationary, or just moving with the atmosphere, cloud/trail of ionisation left behind by the meteor. I haven't fully calibrated the receiver, but it's about 200Hz out so that would move the column close to the radar frequency of 143.050 MHz showing little doppler shift*. The streak is probably a return from the intense (moving) patch of ionisation at the location of the meteor itself. It's a good detection as most tracks only show one or other of these features, and typically much smaller. What confuses me is that if the blob represents a velocity near zero, the trace suggests the meteor moves towards and then away from the receiver. But... the Arietid meteor radiant was just below the horizon a bit beyond north-west. This suggests it came in from the direction of the north Atlantic heading south east, and where the line crosses the blob would represent the point of its closest approach. When the ISS passes over you see exactly the same sort of frequency shift through zero, although it changes much more gradually. The frequency drop is 1,450 Hz (distance between two ends of the trail). This makes the line of sight velocity change about 3,143 metres per second (yes online calculator!) 3.1kms/sec seems fast, but the Arietids arrive with a velocity of about 39 km/s. A bit of trig gives an angle of about five degrees, OK that's rough and ready and assumes we see the full trace but does suggest the meteor was observed nearly fromxwwuio the side, providing a sensible explanation for the doppler shift going through zero. Neil *the Graves frequency is 143,050,000. Tuning to 143,048,800 and listening to the upper sideband means that an unshifted signal will be at 143,050,00-143,048,800 = 1,200Hz. The fact I'm getting it at about 930Hz suggests the tuning calibration is 270Hz out, but measurements of terrestrial staions suggests. |
| Doubletop | 20/06/2018 10:23:53 |
439 forum posts 4 photos | Neil Thanks; I'm getting to understand this so some degree, helped when I found I could zoom the image and read the detail. Surely you can't use the total frequency shift as the indication of velocity as it represents closing and receding velocities? You can only use the deviation from the fundamental +ve and -ve Alternatively could it be the case that the range of the crossing is so great that the closing velocity is relatively minimal and the bright cluster, on the fundamental, is really the main signal with minimal doppler shift. As your array has a wide beamwidth the cluster exits for all the time it is within your beamwidth. Indicated by the height of the cluster (Y). Then the frequency shifts being some sort of spectral noise or harmonics that exist for the duration of the event being at the same time as main cluster? Basically, for any point in time during the event there is a large return on the fundamental plus a secondary signal that sweeps +ve to -ve as the event progresses. It would be good to see a plot with an expanded (Y) axis. In the case of the ISS, as it is so close, there would be doppler shift so it would also be interesting to see a plot of the ISS to see what the ISS spectrum looks like for comparison. Pete
|
Please login to post a reply.
Magazine Locator
Want the latest issue of Model Engineer or Model Engineers' Workshop? Use our magazine locator links to find your nearest stockist!
Sign up to our Newsletter
Sign up to our newsletter and get a free digital issue.
You can unsubscribe at anytime. View our privacy policy at www.mortons.co.uk/privacy
Latest Forum Posts
- hemingway ball turner
04/07/2025 14:40:26 - *Oct 2023: FORUM MIGRATION TIMELINE*
05/10/2023 07:57:11 - Making ER11 collet chuck
05/10/2023 07:56:24 - What did you do today? 2023
05/10/2023 07:25:01 - Orrery
05/10/2023 06:00:41 - Wera hand-tools
05/10/2023 05:47:07 - New member
05/10/2023 04:40:11 - Problems with external pot on at1 vfd
05/10/2023 00:06:32 - Drain plug
04/10/2023 23:36:17 - digi phase converter for 10 machines.....
04/10/2023 23:13:48 - More Latest Posts...
- View All Topics
Support Our Partners


Shopping Partners
Subscription Offer

Latest "For Sale" Ads
- Reeves** - Rebuilt Royal Scot by Martin Evans
by John Broughton
£300.00 - BRITANNIA 5" GAUGE James Perrier
by Jon Seabright 1
£2,500.00 - Drill Grinder - for restoration
by Nigel Graham 2
£0.00 - WARCO WM18 MILLING MACHINE
by Alex Chudley
£1,200.00 - MYFORD SUPER 7 LATHE
by Alex Chudley
£2,000.00 - More "For Sale" Ads...
Latest "Wanted" Ads
- D1-3 backplate
by Michael Horley
Price Not Specified - fixed steady for a Colchester bantam mark1 800
by George Jervis
Price Not Specified - lbsc pansy
by JACK SIDEBOTHAM
Price Not Specified - Pratt Burnerd multifit chuck key.
by Tim Riome
Price Not Specified - BANDSAW BLADE WELDER
by HUGH
Price Not Specified - More "Wanted" Ads...
Get In Touch!
Do you want to contact the Model Engineer and Model Engineers' Workshop team?
You can contact us by phone, mail or email about the magazines including becoming a contributor, submitting reader's letters or making queries about articles. You can also get in touch about this website, advertising or other general issues.
Click THIS LINK for full contact details.
For subscription issues please see THIS LINK.
Digital Back Issues


Donate

 Register
 Log-in
Model Engineer Magazine
- Percival Marshall
- M.E. History
- LittleLEC
- M.E. Clock

ME Workshop
- An Adcock
- & Shipley
- Horizontal
- Mill

Subscribe Now
- Great savings
- Delivered to your door

Pre-order your copy!
- Delivered to your doorstep!
- Free UK delivery!
All Forum Topics > The Tea Room > Meteor detecting